Beyond Glucose Curves
Deborah S. Greco, The Animal Medical Center
The following are my notes from a lecture given March 2005 by Dr. Deborah S. Greco. Any inaccuracies contained within are entirely my responsibility. Please note that this lecture covers both feline and canine diabetes. – Rebecca A. Price MD 3/24/05
Goals of Insulin Therapy
- Resolution of clinical signs of diabetes!
- Decreased PU/PD
- Decreased complications, e.g. neuropathy
- Stable body weight
- Normal glycosylated hemoglobin (Hb a1c) , fructosamine
- Trace to 1 plus urine glucose
- Acceptable blood glucose curve or fasting blood glucose (FBG)
What does a monitoring parameter tell you?
- Blood glucose curves
- Helps determine dose of insulin
- Determines frequency of insulin administration
- May identify Somogyi phenomenon
- Not useful for oral hypoglycemics
- Serum fructosamine
- Helps determine dose of insulin
- Determines owner compliance at home
- Can differentiate stress hyperglycemia from loss of regulation
- Monitoring parameter of choice for oral hypoglycemics
Monitoring diabetics: Parameters
- Initial regulation
- Blood glucose curves
- Urine glucose monitoring (first choice of Dr. Greco)
- Intermediate regulation
- Serum fructosamine
- Fasting BG or mean blood sugar (from BG curve)
- Long-term regulation
- Fructosamine (glycosylated hemoglobin is a poor monitor in cats)
Urine Glucose Monitoring
- Measures trends in blood glucose
- Should NOT be used alone to adjust insulin dosages
- Usually performed at home by owner
- Not affected by stress
- May indicate insulin-induced hyperglycemia
- DOGS
- Collect urine with a long-handled cup holding device
- May use flat pie tin for collecting urine in female dogs
- CATS
- Use plastic wrap over litter and then test urine with dip stick
- Glucotest™ granules in litter – measures various concentrations of glucose in urine, with stablility of 5-8 hours
Urine Glucose Monitoring with Glucotest™
-
Begin animal on 2 U BID of insulin and use glucotest to monitor urine glucose
- If glucotest is NEGATIVE for 2 days, decrease dose to 1 U BID and continue glucotest
- If glucotest is NEGATIVE for 2 days, decrease dose to 1 U SID and continue glucotest
- If glucotest is NEGATIVE for 2 days, discontinue insulin.
Blood Glucose Curve
- Feed same amount and type of food that animal receives at home prior to insulin injection
- Take initial blood sample
- Have owner administer insulin
- Assess owner injection technique
- Take blood samples at two hour intervals for 12-24 hours
Ideal Blood Glucose Curve
- You’ll NEVER get the ideal!
- Ideally, at the time halfway between shots (6 hours for BID shots), the blood glucose will reach its nadir, or lowest point. After the nadir, the BG will gradually rise until time for the next shot of insulin. This “PS” (preshot) value will ideally be the maximum BG and the same as the last PS at time 0.
- The difference between the maximum and minimum values obtained in a blood glucose curve is the GLUCOSE DIFFERENCE, or variation.
- DOGS: The variation should be 100 mg/dl or less
- CATS: The variation should be 150 mg/dl or less
Factors that affect accuracy of glucometers
- Whole blood concentrations are lower than serum glucose
- Altitude
- Oxygen therapy
- Patient hematocrit
- Post prandial state
- Out of date or improperly stored test strips
- Below 100-150 mg/dl, most glucometers are calibrated to read 20 mg/dl LOW! (So look to see if your cat is having symptoms.)
Blood Glucose Curves
- Generally not helpful in cats due to stress hyperglycemia (this refers to at vet glucose curves) and also to the unique physiology of cats!
The thought has been for years that the unreliable data from glucose curves was due largely to the stress of the hospital, lack of adequate food intake, and other factors that created an environment that was nothing like that of the cat’s natural environment. However, newer data is emerging regarding feline metabolism. It had been learned that cats do not use dietary glucose for gluconeogenesis. Rather they use proteins and amino acids. Also emerging are studies that show that the cat can maintain normal glucose levels when deprived of food for 72 plus hours due to the breakdown of muscle tissue as a protein source. Feeding has very little impact on post-prandial glucose levels. Instead, cats increase lactate absorption from the colon resulting in a rise in glucose about 6 hours post-prandial.
- Use mean or fasting blood glucose and serum fructosamine to monitor
- May be helpful in identifying hypoglycemia
- Cats rarely Somogyi
Glycated Blood Proteins (fructosamine, Hb A1c): Indications
- When strict glucose regulation is required
- In subclinical diabetes mellitus
- To differentiate stress hyperglycemia from true diabetes mellitus
- To assess long-term glucose regulation
Fructosamine Monitoring
Results can indicate good, intermediate, or poor long-term control of blood glucose
Reflects recent (1-3 weeks) changes in serum glucose concentrations
In recent years, the lab reference values for “normal” fructosamine levels has risen! This probably indicates that more cats are diabetic and so the bell curve that indicates “normal” has shifted to include higher values. Twenty years ago, the upper limit of normal for fructosamine in cats was about 100 units lower than today’s upper limit of normal.
There used to be a home fructosamine monitor made (Duet, by the LXN Corporation) but it has been discontinued
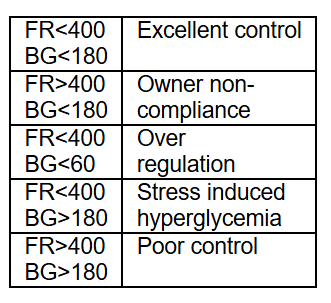
Algorithm: Monitoring with serum fructosamine
Measure blood glucose (BG) and serum fructosamine (FR) and use the numbers together to determine control of diabetes:
Problems with Fructosamine
- Hypoglycemia and over-regulation may be hard to detect
- Sometimes the fructosamine will remain high despite resolution of clinical signs – ALWAYS BELIEVE THE ANIMAL!
- FALSE LOWS can occur with
- Hyperlipidemia
- Hyperthyroidism in cats (HT will raise fructosamine in dogs)
- Hypoalbuminemia
Diabetic Regulation: GHb (Hb A1c)
Dependent on mean red blood cell lifespan (cats – 68 days, dogs – 110 days)
More useful for long-term monitoring in well-regulated diabetics
Use for biannual “check-ups” on diabetic
May correlate better with long-term complications such as cataracts (dogs) and neuropathy (cats)
Glycosylated Hemoglobin
Level of GHB is directly related to degree of hyperglycemia
Relfects glycemic control over the previous 110 days (dogs) or 68 days (cats)
GHB Normal Values
- Normal dogs: 2.9 (0.2)%
- Range 1.8-4.9%
- Diabetic dogs: 5.0 (0.6)%
- Well-regulated – <6.5%
- Normal cats: 1.6 (0.5)%
- Range 0.9-2.5%
- Diabetic cats: 3.0 (0.8)%
- Range 1.3-4.1%
Note the overlap in the ranges for normal cats and diabetic cats. This overlap makes GHB less valuable for monitoring in cats.
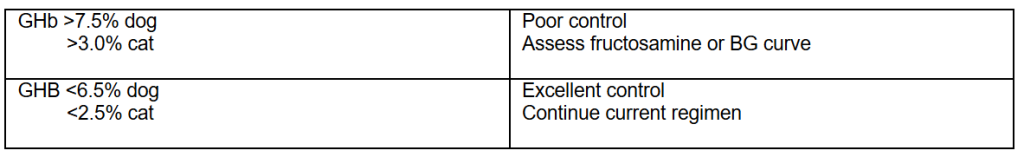
Monitoring diabetics using GHB
Measure GHb: